
Zia Insights
ENTERPRISE EDITIONReports give you details into how your company has been performing through various indicators. Zia Insights is a sidebar in your existing reports, which gives further quick analytics to help you gain a deeper understanding of your company’s performance. This is particularly helpful to assess trends, compare data to previous periods, and view important forecasts related to each report. This can further help you to assess anomalies and take better-informed data-backed decisions for your company’s growth.
Note: Only admins can currently access Zia Insights in reports.
ON THIS PAGE
Types of Analysis in Zia Insights
Zia Insights currently supports the following types of analysis in Zoho Billing:
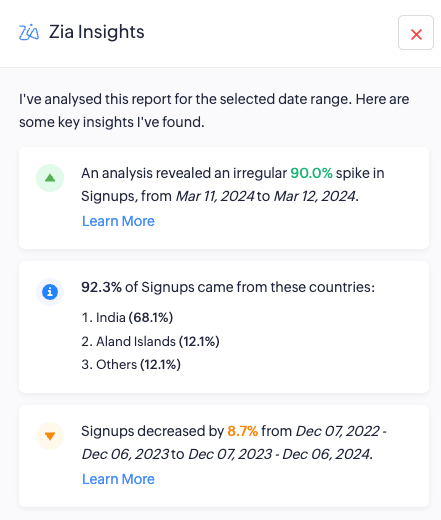
Anomaly Analysis
Anomaly analysis identifies irregular spikes or dips in the chosen date range, highlighting any significant fluctuations, allowing you to detect unusual patterns in the reports easily.
You can also click Learn More to view the analysis period, allowing you to view the exact period when the spike or dip was recorded. This also helps you to understand what factor the change was driven by, along with the top 3 contributing products and countries that led to the change.
Note: The top 3 contributing factors will be displayed only if their contribution towards the data is more than 10%.
Analyzing anomalies can help you detect potential problems or opportunities that the business might not be aware of. For example, a sudden drop in signups could point to an issue with the sign-up process, website errors, or other reasons. On the other hand, a spike can be due to a successful promotional campaign or viral marketing. Detecting these anomalies early can help you take quick data-backed action.
Insight:Anomaly analysis will not be shown if there is no anomaly detected in the selected date range.
Contribution Analysis
Contribution analysis in Zia Insights provides a quick overview of the top 3 factors (Products and Country) influencing specific data in your reports. This is particularly helpful to identify key contributors to changes in data, offering valuable insights to understand trends, analyze marketing campaigns, and make data driven decisions.
Note: Contribution analysis will be shown for the top 3 factors, whose contribution towards the data is more than 10%.
Comparative Analysis
Comparative analysis in Zia Insights highlights the percentage change in your report data between the current and previous periods.
You can click Learn More to view detailed figures showing the exact change from previous period’s data to current period’s data. This also helps you to understand what factor the change was driven by, along with the top 3 contributing products and countries that led to the change.
Note: The top 3 contributing factors will be displayed only if their contribution towards the data is more than 10%.
This is particularly helpful to track trends efficiently and assess period-over-period changes.
Insight:Comparative analysis will be only available for similar periods. For example, if you are viewing a report for the current year, it can be compared with the previous year. Similarly, if you are viewing a report for the current month, it will be compared to the previous month.
Forecasting Analysis
Forecasting is the process of using historical data to predict future trends and outcomes. Forecasting analysis in Zoho Billing uses past trends to analyze and predict an estimated value, allowing you to anticipate future performance and allow proactive decision-making.
Note: Forecast analysis will be displayed only when the current date range is selected.
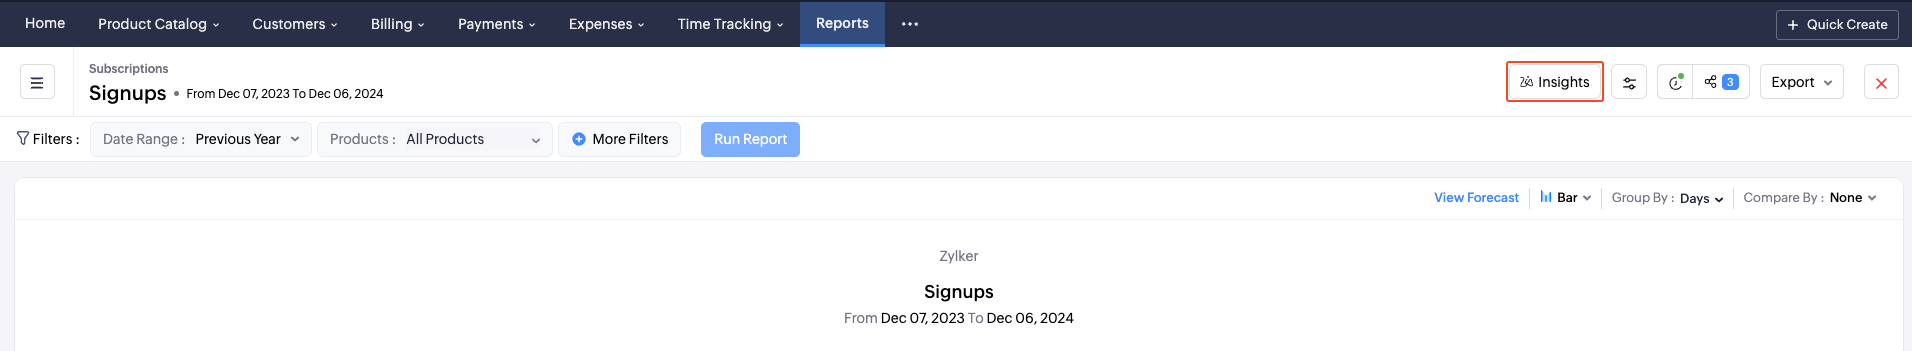
How to access Zia Insights
To view Zia Insights in the supported reports:
-
Navigate to the Reports module.
-
Select a supported report.
-
Click Zia Insights on top.
Supported Reports
The following reports support Zia Insights:
-
Activations
-
Active Subscriptions
-
ARPU
-
ARR
-
Churn Breakdown
-
Downgrades
-
Involuntary Churn
-
LTV
-
MRR Quick Ratio
-
MRR
-
Net Revenue
-
Net Cancellations
-
Net Customers
-
Renewed Subscriptions
-
Revenue Churn
-
Revenue Growth
-
Signups
-
Upgrades
-
Chun Rate
-
Voluntary Churn
Note: Forecast analysis in Zia Analysis is available only in reports which support forecasting.
 Thank you for your feedback!