How we turned IPL 2025 into a live data experience
- Last Updated : May 5, 2025
- 24 Views
- 4 Min Read
At Zoho Analytics, it’s become a bit of a tradition to create dashboards for major sporting events. If you’ve been following us for a while, you might’ve seen our dashboards for FIFA, the Olympics, and the Cricket World Cup.
We’ve also been building dashboards for the IPL for several years now—it’s an annual tournament and a fan favorite. You can check out our blogs on IPL 2023 and IPL 2024 to see what we did in previous seasons.
Each year, the excitement around the tournament grows, and our dashboards grow with it. With new features added to Zoho Analytics, our dashboards get more interactive, insightful, and instant.
This year, thanks to the launch of Zoho Analytics 6.0, we introduced stream analytics, a brand-new feature. That opened the door for something we hadn’t done before: a live streaming IPL dashboard.
Yep: live scores. In real time.
Previously, our dashboards were built on historical data and updated after every match. But with stream analytics, we’ve taken it up a notch. We decided to stream live IPL scores straight into our dashboard.
Here’s a sneak peek:
As you can see, scores update at regular intervals, and the dashboard shows real-time stats like:
- Match details (teams, venue, and toss result)
- Innings one and two (team, score, overs, current run rate, and required run rate)
- Current batsmen and bowlers
- Recent over summary
There are also additional tabs for when no live matches are happening:
- Points table and upcoming fixtures
- Match scorecards
- Insightful reports
Explore the complete IPL 2025 dashboard.
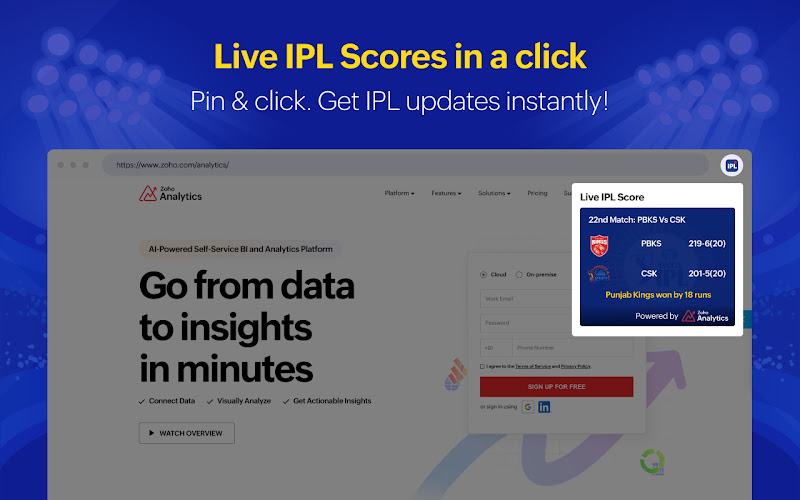
Bonus: A Chrome extension for live scores We also tried something new this year: launching a Chrome extension to show live scores. It’s a compact dashboard that stays on your screen while you work, letting you keep an eye on the match without switching tabs, which is handy during busy work hours.
You can check it out on the Chrome Web Store. |
Time for some insights
Last year, we built two reports to identify top-performing teams in batting and bowling. Interestingly, one team stood out in both categories and went on to win the trophy.
That team? Kolkata Knight Riders.
Naturally, we brought those reports back this year, too.
In terms of batting, Mumbai Indians and Gujarat Titans are performing well.
When it comes to bowling, Mumbai Indians, Royal Challengers Bangalore, Delhi Capitals, Kolkata Knight Riders are doing well.
Currently, Mumbai Indians are in the best quadrants for both batting and bowling. Of course, it’s still early, so keep checking these reports as the league progresses. You might just predict the next winner.
You’ll also find leaderboards for:
- Most runs (Orange Cap contenders)
- Most wickets (Purple Cap contenders)
Browse through our other reports for more insights tailored to your interests.
So, how did we build this live-streaming dashboard?
Let’s break it down.
Building IPL 2025 live dashboard
Step 1: Data integration
We used an API as our data source. Here’s how to set it up:
- In the Import Your Data page, choose API under Streaming Data.
- Enter a workspace name.
- Paste a sample JSON to auto-create the streaming table.
- Review and adjust the generated table structure.
- Click Next to create the streaming model.
- Copy the API URL and use it in your service endpoint to push live data into Zoho Analytics.
For detailed steps, check out our help document on stream analytics.
Step 2: Data preparation
After importing, we cleaned and prepared the data by extracting it from JSON, creating formula columns, and performing other prep actions to make it analysis-ready.
Here’s a video walkthrough of our data integration and preparation:
Step 3: Data visualization
We planned the visualizations we wanted, such as pivot tables, bar charts, pie charts, and more.
Thanks to the drag-and-drop interface, creating data visualizations was easy.
Step 4: Dashboard building
This live dashboard leans heavily on KPI widgets. We listed out what we needed and built them accordingly. Once our visualizations were ready, we organized them into separate tabs for a clean, intuitive user experience.
Watch how we brought the data to life:
Step 5: Dashboard publishing
Zoho Analytics supports several publishing options like shareable links, portals, and embed codes.
For this edition, we embedded the dashboard into our dedicated landing page. All reports and charts are public, so anyone can dive in and explore.
And that’s how the IPL 2025 live dashboard came to life!
About Zoho Analytics
Zoho Analytics is an AI-powered BI and analytics platform trusted by over 20,000 businesses worldwide.
With Zoho Analytics, you can:
- Bring in data from 500+ sources: databases, data lakes, cloud business apps, files, URLs, and more.
- Set up automatic sync at custom intervals.
- Prepare data with 250+ transformations.
- Create reports with 50+ data visualization types.
- Collaborate securely with fine-grained access control.
- Set up smart alerts for anomalies and critical changes.
- Leverage advanced features like Code Studio and AutoML.
- Use Zia, our AI assistant, to:
- Ask Zia: Chat in natural language to create visualizations.
- Zia Insights: Get narrative summaries of your data.
- Zia Suggestions: Get smart recommendations for visualizations.
If you’re a cricket fan and a data nerd (like us), this one’s for you.
Check out the IPL 2025 live dashboard and let us know what you think.
Want to build your own dashboard?
Whether it’s cricket, customers, or campaigns, Zoho Analytics helps you make sense of your data, fast.
Turn your data into decisions with ease.
Get started now and create your first dashboard with Zoho Analytics.
Try our 15-day free trial. No credit card required.
 Pradeep V
Pradeep is a product marketer at Zoho Analytics with a deep passion for data and analytics. With over eight years of experience, he has authored insightful content across diverse domains, including BI, data analytics, and more. His hands-on expertise in building dashboards for marketing, sales, and major sporting events like IPL and FIFA adds a data-driven perspective to his writing. He has also contributed guest blogs on LinkedIn, sharing his knowledge with a broader audience. Outside of work, he enjoys reading and exploring new ideas in the marketing world.